

- Apr 9
- 8 min read
Updated: Apr 15

Table of Content
For Quant Portfolio Managers For Fundamental Investors Methodology Note Signal Summary for Distribution Research shows what moves prices
Signal Summary
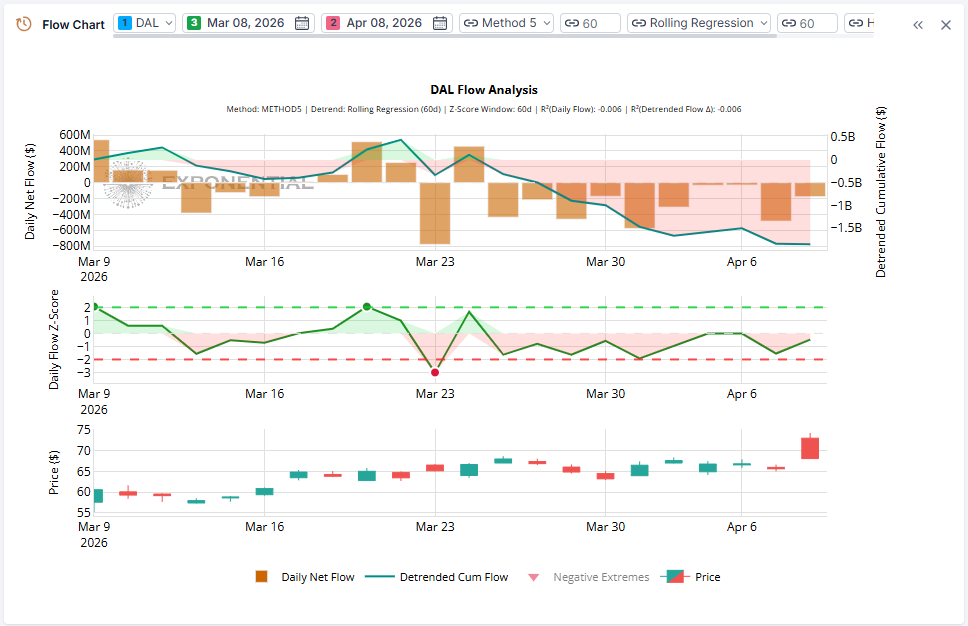
DAL exhibited a $2.3 billion peak-to-trough decline in institutional detrended cumulative flow over 13 trading sessions (March 20 – April 8, 2026), initiated by a 3-sigma distribution event (Z: -3.00) on March 23 — the most extreme single-session institutional outflow in the 60-day observation window.
This case study examines what the 1-minute flow decomposition reveals about the persistence of this distribution regime through multiple positive price catalysts, including the April 8 session where Q1 earnings beat consensus and a US-Iran ceasefire drove oil prices down 16%, yet institutional flows remained net negative.
Intraday granularity on April 8 identifies the first institutional re-entry signal emerging in the final hour after sustained morning and midday distribution.
Flow Data Snapshot — Key Inflection Points
Date | Investor Type | Daily Net Flow | Z-Score | Detrended Cum. Flow | Price Action | Interpretation |
Mar 19 | Institutional | +$516M | +2.06 | +$232M | +1.9% | Peak accumulation rate; highest positive Z in the observation window |
Mar 20 | Institutional | +$253M | +0.98 | +$444M (peak) | -2.4% | Detrended cumulative positioning peaks; buying into weakness signals conviction |
Mar 23 | Institutional | -$779M | -3.00 | -$332M | +2.7% | Regime break: $776M cumulative swing in one session; distribution into rising price |
Mar 25 | Institutional | -$436M | -1.63 | -$312M | +2.0% | Full reversal of Mar 24 rebound (+$459M, Z: +1.66); distribution resumes into strength |
Mar 31 | Both | Inst: -$577M / Ret: +$3.1M | Inst: -1.92 / Ret: +1.13 | Inst: -$1,475M / Ret: +$3.0M | +5.2% | Peak divergence: institutional distribution on the window's strongest rally; retail provides liquidity |
Apr 7 | Both | Inst: -$485M / Ret: +$1.1M | Inst: -1.55 / Ret: +0.09 | Inst: -$1,844M / Ret: +$1.5M | -1.7% | Pre-catalyst de-risking; 52% of institutional outflow concentrated in final hour |
Apr 8 | Both | Inst: -$175M / Ret: -$0.6M | Inst: -0.47 / Ret: -0.78 | Inst: -$1,857M / Ret: -$0.2M | +3.7% | Dual catalyst fails to reverse distribution; intraday shows first institutional buying signal in final hour |
The distribution regime produced six sessions with institutional Z-scores below -1.5 between March 23 and April 7 — an unusual clustering given the simultaneous price recovery.
The Mar 23 regime break (Z: -3.00) occurred on a day price rose +2.7%, which distinguishes it from reactive selling and marks it as the highest-information event in the window.
Notably, the only session where institutional flows briefly reversed course (Mar 24: +$459M, Z: +1.66) was fully unwound within 24 hours (Mar 25: -$436M, Z: -1.63), confirming the distribution thesis rather than refuting it.
Signal Analysis
Institutional Flow Regime
The observation window divides into two distinct regimes. The first eight sessions (March 10–20) exhibited net accumulation, with detrended cumulative flow rising from +$156M to its March 20 peak (see inflection table). The peak accumulation rate occurred on March 19 (see inflection table), the only session to exceed +2.0 standard deviations. Buying on March 20 pushed the peak higher even as price declined -2.4% — consistent with conviction-based positioning.
March 23 marks the inflection. A -$779M outflow (Z: -3.00) erased the accumulation phase in a single session, swinging detrended cumulative flow to -$332M. This occurred on a +2.7% price day, meaning distribution was absorbing liquidity from participants willing to bid price higher.
From March 23 through April 8, institutional net flow was negative on 11 of 13 sessions. The lone positive session (Mar 24) was immediately reversed the following day. The late-March acceleration is notable — three consecutive sessions (Mar 25–27) sustained Z-scores below -0.80, followed by the window's second-largest outflow on March 31 (Z: -1.92) into a +5.2% rally.
April sessions continued with lower intensity but unbroken directionality, adding another -$383M of cumulative decline through the catalyst date.
Retail-Institutional Divergence
Retail flow operated at two orders of magnitude below institutional levels ($19.9M peak-to-trough vs. $2,301M). The directional characteristics are nonetheless informative.
During the distribution phase (Mar 23 – Apr 7), retail was a net buyer on 9 of 12 sessions. The March 31 divergence was starkest: the 186:1 dollar ratio (see inflection table) means retail was functioning as a marginal liquidity provider, not a material price-setting force. Other institutional participants — likely market makers and passive vehicles — absorbed the bulk of directed flow.
By April 8, retail turned marginally negative (-$0.6M), eliminating the last directional divergence. Both investor types registered negative net flow on the catalyst day — a convergence suggesting the distribution signal had propagated to the broader participant base.
Cumulative Flow Trajectory
Three distinct acceleration phases drove the cumulative decline: (1) the March 23 regime break (-$776M single-session swing), (2) the March 25–27 cascade (-$1,208M over three sessions), and (3) the March 31 distribution-into-strength event. April sessions continued the regime at lower intensity without reversal.
Retail cumulative flow eroded gradually from +$19.7M (March 12) to -$0.2M (April 8), crossing zero for the first time in the observation window on the catalyst date.

Intraday Flow Decomposition: April 7–8
The 1-minute institutional flow data for April 7–8 adds granularity that the daily aggregates obscure.
April 7 (pre-catalyst session):
Total institutional net flow of -$480M was heavily back-loaded.
The 9:30–10:00 open produced -$74M and the 10:00–11:00 window added -$125M, consistent with measured position reduction.
The midday sessions (11:00–15:00) contributed only -$32M — a near-pause in the distribution.
Then, the final hour (15:00–16:00) produced -$249M, representing 52% of the day's total outflow in 16% of the trading session.
This concentration is consistent with portfolio-level de-risking ahead of a known catalyst (earnings were pre-market April 8), not reactive price-following.
The Z-score range in the final hour ([-7.24, +6.36]) indicates violent microstructure conditions.
April 8 (earnings beat + ceasefire):
The daily aggregate of -$175M masks a clear intraday regime transition.
The first 90 minutes (9:30–11:00) produced -$197M of institutional outflow as the initial gap-up was met with distribution.
The 11:00–13:00 session added another -$138M — the heaviest sustained midday selling in the April 1–8 intraday window.
Then, selling exhausted: the 13:00–15:00 block produced only -$5M.
The final hour flipped to +$69M — the only positive institutional flow segment of the day and the first detectable institutional re-entry signal since March 24.
The Z-score peak of +6.39 in this final hour suggests the buying was concentrated in discrete bursts, not a smooth re-accumulation.

This intraday transition — from aggressive morning distribution to final-hour buying — is the most analytically consequential finding. It suggests that while the majority of institutional participants continued to distribute through the catalyst, a subset began repositioning into the close as the ceasefire narrative stabilized and WTI settled 16% lower on the session.
For Quant Portfolio Managers
Signal construction relevance.
The March 23 regime break (Z: -3.00 on a +2.7% price day) carries reversal signal properties: institutional selling against positive price action, followed by cumulative price decline of -5.5% over the subsequent week.
However, the March 31 episode (Z: -1.92 on +5.2%) complicates a clean reversal narrative.
The signal maps more precisely to a macro-conditional factor — institutional de-risking under geopolitical fuel-cost uncertainty — rather than a pure stock-level reversal.
Timing properties.
The detectable flow shift preceded the most significant price decline by 2–5 sessions.
Detrended cumulative flow turned decisively negative on March 23; the price decline phase began March 25.
For April 8, pre-event positioning reduction (April 7, Z: -1.55) was detectable one session prior, though the price response was positive — suggesting the institutional signal was risk management rather than directional prediction.
Cross-sectional context.
This is not idiosyncratic to DAL. Iran-US escalation in late March drove broad institutional de-risking across fuel-sensitive sectors.
A systematic strategy constructed on institutional flow deterioration in airline names during the March 20–April 7 window would have captured the sector-wide rotation.
The April 8 ceasefire introduces a potential regime reversal condition — intraday final-hour buying is a candidate leading indicator for sector re-entry.
Backtestable hypothesis.
Airline names where institutional detrended cumulative flow declines >$1B from 60-day peak within 10 sessions, coincident with crude oil increases >20%, show asymmetric forward return distributions on the first session following a crude decline >10%.
Cross-validation across 2020 OPEC normalization and 2022 Russia-Ukraine ceasefire episodes would assess persistence.
Risk and noise considerations.
The April 7 final hour (Z range: [-7.24, +6.36]) and April 8 morning gap represent microstructure conditions where classification accuracy degrades.
The pre-market earnings release means April 8 opening bars included price discovery under elevated information asymmetry.
Cross-referencing with exchange-level data (NYSE vs. off-exchange) could isolate informed flow from liquidity provision.
For Fundamental Investors
Over the 22-session observation window ending April 8, 2026, institutional detrended cumulative flow in DAL traversed the full peak-to-trough arc documented above that represents one of the more severe institutional conviction shifts in a large-cap airline name during this period.
The practical interpretation is that the market's largest participants spent three weeks systematically reducing their DAL exposure, and they did so primarily by selling into rising prices rather than chasing declines. On the five strongest rally days in the window (+5.2%, +3.5%, +2.7%, +2.3%, +2.0%), institutional net flow was negative on four of them. This is deliberate portfolio de-risking, not reactive selling.
The context matters. Iran-US tensions pushed WTI crude above $100/bbl in late March, adding approximately $2.6 billion to Delta's annualized fuel bill. Delta's Q1 earnings (reported April 8) confirmed the cost pressure: a net loss of $289 million despite revenue beating estimates. Institutional selling throughout late March is consistent with a view that the fuel cost headwind was structural enough to warrant position reduction regardless of short-term price direction.
The April 8 dual catalyst — earnings beat and ceasefire-driven oil decline — did not reverse the distribution at the daily level. However, the 1-minute data shows the first institutional buying in the final trading hour, after WTI settled at $94/bbl. The conditions that would suggest a genuine regime change: sustained institutional net buying (not single-hour episodes) coincident with detrended cumulative flow inflecting upward from its current trough. Until that materializes, the flow data characterizes a distribution regime that remains intact.
Methodology Note
Data source.
XTech Flow data is derived from LSEG Data Analytics trades across all reporting venues. Daily analysis uses end-of-day aggregation; intraday analysis uses 1-minute intervals across the April 1–8, 2026 window.
Flow decomposition.
The proprietary classification algorithm separates institutional buy-side, market maker, and retail flow using microstructure features derived from 20+ years of HFT expertise
Z-score construction.
Standardized against the 60-day rolling window of daily net flows for each investor type. Values represent statistical rarity in that stock's recent history, not universal thresholds. Cumulative flows are detrended via rolling 60-day Huber regression to remove secular drift and isolate cyclical positioning changes. Intraday Z-scores use a 60-minute rolling window at 1-minute granularity, producing wider ranges than the daily metric.
Limitations
Classification accuracy degrades during opening 30 minutes and gap events — both present on April 8.
Single-day Z-score extremes require detrended cumulative flow context to distinguish signal from noise.
Observations near the 60-day detrending window boundary carry higher estimation uncertainty.
Past flow patterns do not constitute predictive claims.
Signal Summary for Distribution
DAL Flow Intelligence Summary — April 8, 2026
Observation window: March 10 to April 8, 2026 (22 sessions)
Key finding: Institutional detrended cumulative flow declined $2,301M from March 20 peak to April 8 trough, driven by a 3-sigma distribution event (Z: -3.00) on Mar 23 and sustained by six sessions with Z < -1.5. Distribution persisted through the April 8 dual catalyst (Q1 earnings beat + US-Iran ceasefire, oil -16.4%).
Institutional flow regime: Distribution (unbroken since Mar 23)
Peak cumulative flow: Mar 20 Key divergence event: March 31 — Institutional -$577M (Z: -1.92) vs. Retail +$3.1M (Z: +1.13) on +5.2% price; 186:1 dollar ratio
Intraday signal: April 8 final-hour institutional net buying of +$69M — first positive intraday segment since March 24
Hypothesis for validation: Airline names with institutional detrended cumulative flow decline >$1B from 60-day peak during crude oil surges >20% show asymmetric positive returns on the first session following a crude decline >10%
Data: XTech Flow US Equity Flow Analytics | 1-min granularity | derived from LSEG Data Analytics
Our research shows what really moves stock prices
For decades, asset pricing has been dominated by fundamentals. New research proves this view is incomplete.
The primary mechanical driver of stock prices is not fundamentals, but the force of institutional order flows.


Comments