

- Apr 27
- 9 min read

Table of Content
IBM Flow Analysis For Fundamental Investors Methodology Note Signal Summary for Distribution Our research shows what really moves stock prices
IBM Equity Flow Signal Summary
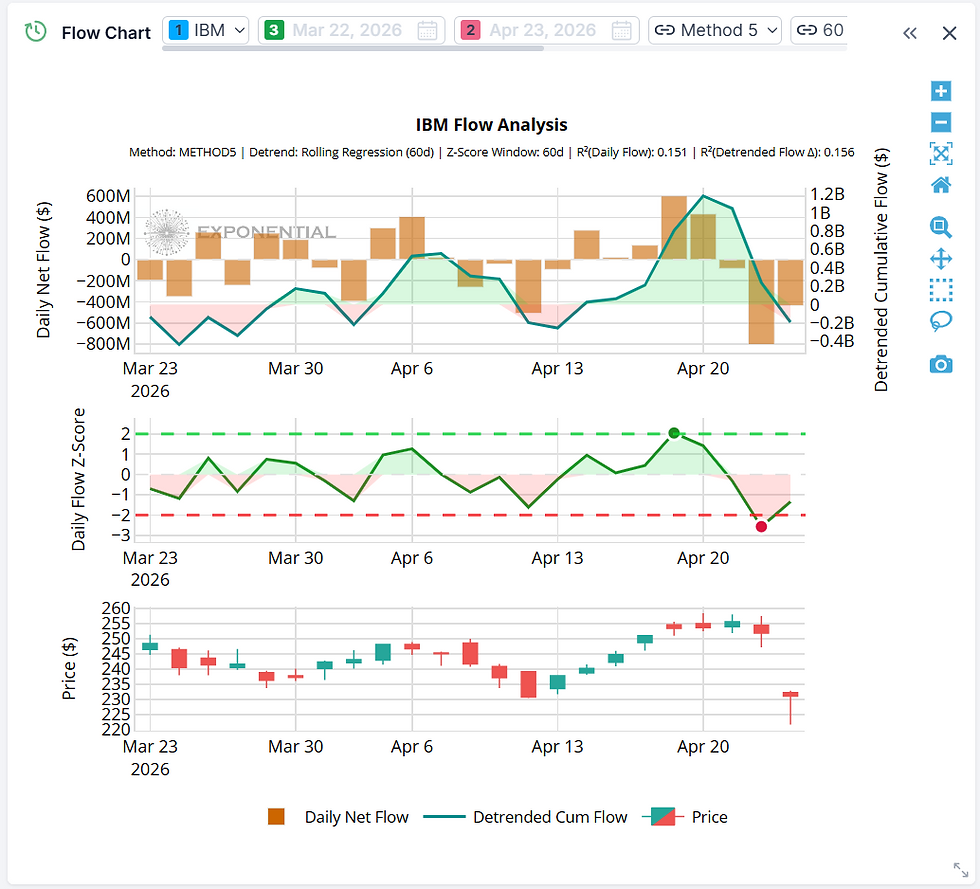
IBM exhibited a $1.37 billion institutional detrended cumulative flow reversal between April 20 and April 23, 2026 — the most extreme repositioning event in the 60-day observation window.
Institutional buy-side flow peaked at +$1.18B detrended cumulative on April 20 (T-3 relative to the post-earnings session), driven by two consecutive days of outsized accumulation (Z: +2.04 and +1.42).
Distribution began on earnings day (April 22, Z: -2.57) and continued into the post-report session, fully unwinding and overshooting the prior accumulation to -$192M detrended cumulative.
Retail flow simultaneously recorded a 6.23-sigma event on April 23 — the most statistically extreme retail buying day in the dataset — absorbing institutional supply at an 8.2:1 dollar ratio.
This case study examines what the 1-minute flow decomposition reveals about the information content of the pre-earnings institutional positioning signal and its subsequent reversal.
IBM Flow Data Snapshot — Key Inflection Points
Date | Investor Type | Daily Net Flow | Z-Score | Detrended Cum. Flow | Price Action | Interpretation |
Apr 6 | Institutional | +$408M | +1.26 | +$525M (local peak) | -0.6% | Early accumulation contra price; positioning builds ahead of broader rally |
Apr 10 | Institutional | -$508M | -1.61 | -$198M (trough) | -2.7% | Drawdown clears prior accumulation; position reset precedes mid-April rebuild |
Apr 17 | Institutional | +$602M | +2.04 | +$803M | +1.0% | Peak daily buying intensity in window; pre-earnings accumulation accelerates |
Apr 20 | Institutional | +$431M | +1.42 | +$1,180M (window peak) | +0.1% | Detrended cumulative peaks; T-3 before post-earnings session |
Apr 22 | Institutional | -$803M | -2.57 | +$236M | -1.5% | Most extreme daily selling in window; distribution intensifies into final hour (-$266M in last 60 min) |
Apr 22 | Retail | +$21.5M | +4.15 | +$25.5M | -1.5% | Retail absorbs institutional distribution at 37:1 dollar ratio |
Apr 23 | Institutional | -$435M | -1.34 | -$192M | -8.3% | Continued distribution; $1.14B sold in first 30 minutes (intraday cumulative) |
Apr 23 | Retail | +$52.9M | +6.23 | +$71.6M | -8.3% | Most extreme retail buying event in observation window; 8.2:1 absorption ratio |
The observation window divides cleanly into three regimes: a noisy accumulation phase (March 24–April 10), an aggressive pre-earnings build (April 14–20), and a two-session liquidation (April 22–23).
The accumulation-to-distribution arc is unusually symmetric in magnitude — $1.39B accumulated over six sessions, $1.24B distributed over two — but asymmetric in velocity, with the exit executing at more than three times the rate of the build.
IBM Flow Signal Analysis by Investor Type
Institutional Flow Regime
The 60-day detrended cumulative flow trajectory for IBM's institutional buy-side describes a clear accumulation-to-distribution arc, with the inflection point identifiable at April 20. The early window (March 24–April 10) was directionally noisy, oscillating between -$435M and +$525M detrended cumulative, with no sustained regime. The regime shifted decisively on April 14, when institutional net flow turned positive and remained so for four consecutive sessions.
The intensity of the pre-earnings build is notable. April 17 and April 20 combined for $1.03B in net institutional buying — 74% of the six-session accumulation total concentrated in just two days. The April 17 session registered a Z-score of +2.04, the highest daily institutional flow reading in the entire observation window. This was not gradual positioning; it was concentrated, high-conviction accumulation occurring on low-volatility days (price moved +1.0% and +0.1% respectively).
Distribution was equally concentrated but faster. The April 22 session — when IBM reported Q1 results after hours on the 22nd but the market had the full day to position ahead of the report — registered -$803M in net institutional outflow (Z: -2.57). Intraday decomposition reveals the selling was not front-loaded: institutions sold $-10M in the first hour, but $-266M in the final hour alone, suggesting a deliberate acceleration into the close rather than a reactive liquidation. By session end, detrended cumulative flow had declined from +$1,045M to +$236M — a single-session reduction of 77%.
The April 23 session completed the reversal. The April 23 institutional outflow (see table) pushed detrended cumulative flow below zero, fully breaching the trend line and moving into net distribution territory. Intraday data shows $1.14B in cumulative institutional selling within the first 30 minutes, followed by modest buying in the 10:00 hour (+$169M) that proved temporary. Selling resumed and persisted through the close.

The two-session distribution totaling $1.24B represents 89% of the prior six-session accumulation of $1.39B, executed in one-third the time. The Z-score on April 22 (-2.57) was more extreme than the peak accumulation day (+2.04), indicating the exit was conducted with greater urgency than the entry.
Retail-Institutional Divergence
The retail-institutional divergence on April 22–23 is among the most pronounced in the dataset. On the earnings reaction day (April 23), retail net flow of +$52.9M (Z: +6.23) represented the single most statistically extreme retail buying event in the 60-day window, while institutional flow continued its distribution regime (see table, April 23 row).

The dollar ratio underscores the asymmetry: institutional selling exceeded retail buying by 8.2x on April 23. Retail was acting as a liquidity provider, absorbing a fraction of institutional supply, not as a directional counterparty with comparable capital weight. On April 22, the ratio was even more extreme at 37:1.
Timing analysis from intraday data reveals retail buying on April 23 was heavily front-loaded — $43.5M of the $73.2M intraday cumulative occurred in the first 30 minutes — coinciding precisely with the period of maximum institutional selling pressure. This is consistent with retail acting as a reactive liquidity provider to the gap-down open, not as an informed counterparty establishing a contrarian position.

The retail detrended cumulative flow trajectory is also instructive: it was approximately flat through April 21 (ranging -$2.1M to +$7.9M), then surged to +$71.6M over the final two sessions. Retail positioning shifted from neutral to its most extreme long reading in the window precisely as institutional positioning reversed — a textbook divergence pattern.
Detrended Cumulative Flow Interpretation
The institutional detrended cumulative flow swung from the March 24 trough to the April 20 peak and back below zero by April 23 close (see inflection table). The peak-to-trough decline of $1.37B in three trading sessions constitutes a 116% reversal relative to the peak — meaning institutions not only unwound their accumulated position but moved to a net distribution level below the 60-day trend.
The structural versus event-driven decomposition is informative. The accumulation phase (April 14–20) exhibited moderate daily Z-scores (+0.08 to +2.04), consistent with deliberate positioning rather than a single catalyst. The distribution phase exhibited one extreme Z-score (-2.57 on April 22) followed by a more moderate reading (-1.34 on April 23), suggesting the initial exit was high-urgency but the follow-through was more measured — consistent with a portfolio that de-risked in bulk on earnings day and cleaned up the residual position the following session.
The 60-day regression window is the default for detrending. Given that the accumulation phase spanned only 6 of the 22 sessions in the dataset, the detrended values near the window boundaries (March 24) should be interpreted with appropriate caution regarding regression endpoint sensitivity.
IBM Flow Analysis For Quant Portfolio Managers
The IBM flow event maps to a well-documented pattern in the institutional positioning literature: pre-catalyst accumulation followed by rapid post-catalyst distribution, where the distribution velocity exceeds the accumulation velocity by a factor of 3x or more. This is distinct from a pure earnings momentum signal — the institutional detrended cumulative peak occurred at T-3 (April 20), not on the event day itself, suggesting the flow signal has a lead component that pure price-based signals would miss.
From a signal construction perspective, the timing properties are specific: the transition from accumulation to distribution occurred within a single session (April 22), with intraday intensity shifting from neutral in the morning to extreme selling in the final hour. A signal derived from end-of-day detrended cumulative flow changes would have detected the regime shift by April 22 close — one full session before the -8.3% price decline on April 23. This implies a signal horizon of at least T+1 for names with earnings catalysts, though the generalizability of this lead time requires cross-sectional validation.
The retail Z-score extremity (6.23σ) co-occurring with institutional distribution is itself a candidate signal. Backtestable hypothesis: In large-cap names where the institutional daily Z-score falls below -2.0 concurrent with retail daily Z-score exceeding +4.0 within the earnings window (T-1 to T+1), the forward 5-session return distribution skews negative, with the retail flow extreme serving as a contrarian indicator of further downside — the retail buying exhaustion preceding the final price leg lower.
Cross-sectional context is relevant: IBM's sell-off occurred on a day when the enterprise software sector declined broadly (ServiceNow -17.8%, the software sector's worst performer). The institutional flow regime in IBM may partly reflect sector-level de-risking rather than purely idiosyncratic positioning. A systematic strategy would need to decompose the IBM institutional flow signal into its idiosyncratic and sector components — potentially using peer-group institutional flow as a control — to assess the alpha content specific to IBM versus the software factor rotation.
Risk considerations: IBM's average daily volume and market capitalization support high classification accuracy in the flow decomposition model. However, the April 23 session involved a gap-down open of approximately 7%, which compresses effective trade classification accuracy during the first minutes of the session as price discovery occurs through rapid order flow. The intraday Z-score extremes (institutional: -5.61 in the 09:00 hour) should be interpreted with this caveat.
IBM Flow Analysis For Fundamental Investors
Over the 60-day window ending April 23, institutional detrended cumulative flow traced a complete round trip — from the March 24 trough through the April 20 peak and back below the 60-day trend by April 23 — a trajectory that reveals three distinct chapters in how the market's largest participants sized their IBM position.
The pre-earnings accumulation (April 14–20) tells us that institutional buy-side participants were adding to IBM with above-trend conviction. The $1.03B accumulated on April 17 and 20 alone suggests concentrated positioning ahead of a known catalyst. The question this raises: were institutions building for an expected earnings beat, or were they front-running index rebalancing flows? The flow data alone cannot answer this, but the abruptness of the reversal on earnings day argues against mechanical positioning.
The earnings-day distribution is the most informative signal. IBM reported Q1 revenue of $15.92B (beating estimates) and EPS of $1.91 (beating consensus), yet institutions executed the most extreme daily selling event in the observation window. The results were optically positive but failed to address the market's core concern: consulting segment growth of just 1% amid AI disruption concerns, and reiterated (not raised) full-year guidance following the Confluent acquisition. The flow data suggests institutional participants evaluated the same report retail investors saw — and reached a different conclusion about its forward implications.
The detrended cumulative flow level at April 23 close indicates institutions are now positioned below their 60-day trend — net sellers relative to their own recent history. For this signal to suggest a regime change toward re-accumulation, two conditions would need to emerge: (1) institutional daily net flow returning to sustained positive readings (Z > +1.0) for three or more consecutive sessions, and (2) detrended cumulative flow re-crossing zero from below. Until those conditions are met, the flow data characterizes the current regime as post-distribution stabilization, not re-entry.
Methodology Note
Data source:
All flow data is derived from the US Consolidated Feed (LSEG), capturing trades across all lit US equity venues. Data is aggregated at 1-minute intervals throughout regular trading hours (09:30–16:00 ET).
Flow decomposition:
The proprietary classification algorithm separates institutional buy-side, market maker, and retail flow using microstructure features derived from 20+ years of HFT expertise
Z-score construction:
Daily net flow Z-scores are standardized against the rolling 60-day window of daily net flows for each investor type. A Z-score of +2.04 (April 17 institutional) indicates a flow event 2.04 standard deviations above the 60-day mean for IBM institutional buy-side activity — a contextually infrequent event for this stock, not a universal threshold. Intraday Z-scores use an expanding window within the session. Cumulative flows are detrended via rolling 60-day Huber regression to remove secular drift and isolate cyclical positioning changes.
Limitations:
Classification accuracy, while robust for large-cap names, is not 100% — single-day readings should be contextualized with detrended cumulative flow trends
The 60-day regression window means detrended values near the start of the observation period (March 24) are influenced by data outside the displayed window
Flow data describes positioning changes, not intent — causal attribution (e.g., "institutions anticipated the earnings miss") is inference, not observation
Past flow patterns do not constitute predictive claims about future price direction.
Signal Summary for Distribution
IBM (IBM) Flow Intelligence Summary — April 23, 2026
Observation window: March 24 to April 23, 2026
Key finding: Institutional detrended cumulative flow reversed $1.37B from peak (+$1,180M, Apr 20) to -$192M (Apr 23) — the largest repositioning event in the 60-day window, executing in 3 sessions at 3x the accumulation velocity.
Institutional flow regime: Accumulation → Distribution (inflection: April 22) Peak detrended cumulative flow: +$1,180M, April 20 Key divergence event: April 23 — Institutional Z: -1.34, Retail Z: +6.23 (most extreme retail buying in window); 8.2:1 institutional selling to retail buying ratio
Hypothesis for validation: Large-cap names exhibiting institutional Z < -2.0 concurrent with retail Z > +4.0 within the earnings window show negatively skewed forward 5-session returns
Data: XTech Flow US Equity Flow Analytics | 1-min granularity | derived from LSEG Data Analytics
Our research shows what really moves stock prices
For decades, asset pricing has been dominated by fundamentals. New research proves this view is incomplete.
The primary mechanical driver of stock prices is not fundamentals, but the force of institutional order flows.


Comments