

- Dec 11, 2025
- 8 min read
The Oracle Paradox: When Beating Earnings by 38% Costs You 11%
Oracle Corporation (ORCL) reported fiscal Q2 2026 earnings on December 10, 2025 that beat expectations on nearly every metric. The company crushed EPS estimates by 38% ($2.26 vs. $1.64), grew cloud infrastructure revenue 68%, and revealed a staggering $523 billion backlog—up 438% year-over-year—driven by new commitments from Meta, Nvidia, and others tied to the massive Stargate AI infrastructure project.

Then it dropped 11% in after-hours trading.
For investors watching the stock, this felt like a sucker punch. Oracle had just delivered what should have been a blowout quarter. The remaining performance obligations (RPO) of $523 billion represented one of the largest backlog announcements in corporate history. Cloud infrastructure was accelerating at the exact moment AI demand was exploding. Yet the market sold off violently.
What you might not know is who was buying—and who was sitting out—in real-time in the days and moments leading up to earnings. While retail traders gambled heavily on December 10, buying into the actual earnings announcement with extreme Z-scores of +2.5, institutional flows remained notably subdued throughout the entire period.
Don't Trade on Headlines. Trade on Flows.
The Valuation Tightrope Nobody's Talking About
The Oracle situation perfectly encapsulates the current AI infrastructure dynamic. On one hand, Oracle has positioned itself at the center of the AI boom through its $500 billion Stargate partnership with OpenAI and SoftBank—a project that aims to build 10 gigawatts of AI datacenter capacity across the United States by end of 2025. The company's Oracle Cloud Infrastructure (OCI) is hosting all five of the world's leading AI models, and analysts project Oracle's cloud infrastructure market share will grow from roughly 5% today to 16% by 2029.
But here's what makes Oracle different: the company is funding this AI vision almost entirely through debt. Oracle's total debt load stands at $111.6 billion, with fiscal 2026 capital expenditures now projected at $50 billion—up from $35 billion just three months ago, and more than double the $21.2 billion spent in fiscal 2025. Free cash flow turned negative by about $10 billion in Q2, worse than the $5.2 billion negative consensus estimate.
The real question isn't whether Oracle is a good company positioned in a powerful secular trend—it clearly is. The question is: who's positioned for the next move, and who's stuck holding the bag?
Timing is Everything
On the earnings call, Oracle's Principal Financial Officer Doug Kehring emphasized the massive new commitments: "Remaining Performance Obligations increased by $68 billion in Q2—up 15% sequentially to $523 billion—highlighted by new commitments from Meta, NVIDIA, and others." Chairman Larry Ellison revealed Oracle sold its interest in Ampere, the chip company, to pursue a policy of "chip neutrality" where Oracle works closely with all CPU and GPU suppliers.
This all sounds bullish. And it is—for the long term. But it also creates a paradox: Oracle is making a massive, leveraged bet that today's AI demand will persist and monetize over a decade or more. Bulls see this as visionary. Bears see it as fragile.
Traditional data tells you what happened yesterday. By the time you see the headline "Oracle beats earnings," institutional money has already repositioned.
Why You're Always Late
Quarterly reports: 90 days old by the time they're filed
Analyst upgrades: Come after the move has started
Financial media headlines: The good news is already absorbed into the price
Credit default swaps: Oracle's CDS spreads had already spiked to crisis-era levels weeks before earnings
LSEG Equity Flow data, Powered by Exponential Technology, shows you what's happening minute by minute. Not summaries. Not interpretations. Raw flow data segmented by investor type—institutional, retail, market makers—across all US equities and venues.
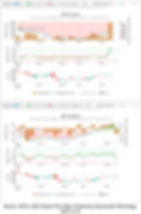
What the Flow Data Revealed About Oracle's December 10 Move
Let's look at what actually happened in the days surrounding Oracle's earnings announcement. The daily flow charts tell a remarkably clear story:
Pattern: Retail Hope Meets Reality Check
The Retail Story (Top Charts)
Looking at the daily retail flow data from early December through December 10:
December 4: Retail buying begins to pick up as the stock bounces from its November lows around $200. The detrended cumulative flow shows the start of an upward trend.
December 5-9: Modest retail participation continues throughout this period with similar behavior each day. Retail investors appear to be cautiously buying the dip ahead of the December 10 earnings, betting that strong AI demand would translate into a beat that reverses the 32% decline from September highs. Flow remains positive but measured during these days.
December 10 (Earnings Day): Retail flow explodes. The daily Z-score hits +2.5—a statistically extreme event well above the +2 threshold that indicates unusually strong buying. Net retail flow reaches approximately 120 million. The detrended cumulative retail flow shows a sharp upward acceleration on this day. This represents retail FOMO in its purest form: buying heavily into the actual earnings announcement, hoping to catch the post-earnings pop.
Retail traders weren't positioned ahead—they were gambling on the day itself. They bought into earnings at $220-223, hoping for a miracle, and are now facing a stock trading around $197 after the 11% after-hours drop.
The Institutional Story (Bottom Charts)
Here's where it gets interesting. The institutional flow data tells a much different story:
December 5, 8, and 9: Modest positive institutional flow of around $0.5 billion each day. No extreme Z-scores. No panic buying. Institutional flow remained measured and subdued throughout the pre-earnings period.
The divergence is striking: While retail Z-scores spiked to +2.5 (statistically extreme), institutional Z-scores hovered between 0 and +0.5 (completely normal range). Institutions showed no comparable enthusiasm. Their detrended cumulative flow increased gradually but without acceleration.
Click to expand.
What This Actually Means
Institutions remained cautious even as retail rushed in on earnings day. While retail bought heavily into the December 10 announcement, institutions had shown only modest participation throughout the preceding week.
This is why the 11% after-hours drop happened:
✅ Retail accumulation: Started December 4, remained modest through December 9, then exploded December 10 (Z-score +2.5)
❌ Institutional caution: Modest flows throughout, no statistical extremes
✅ Timing divergence: Retail buying into earnings day announcement, institutions staying measured throughout
❌ Classic mistake: Retail gambling on earnings day itself, buying at the absolute worst moment
The Advance Warning
The flow data gave advance warning through the lack of institutional enthusiasm. If you tracked institutional flows remaining subdued at normal Z-scores (0 to +0.5) throughout the week leading to December 10, even as retail Z-scores spiked to +2.5 on earnings day, you knew this was a dangerous setup—not a buying opportunity. The pattern was clear:
Retail extreme buying on earnings day (+2.5 Z-score) = Desperation/gambling
Institutional measured participation throughout (0 to +0.5 Z-score) = Skepticism about debt, software weakness, and valuation
Result: Even a 38% EPS beat couldn't save retail buyers who gambled on earnings day
If you saw retail exploding on December 10 without institutional enthusiasm building beforehand, you knew this was a high-risk event—not an opportunity. The flow data showed that what looked like bullish conviction was actually retail gambling on a binary outcome into a heavily debated earnings event.
What Makes LSEG Equity Flow Data Different
1. Granularity
Minute-level intervals with 17 years of historical data. For this Oracle pattern, the daily view was all you needed to see the critical divergence: retail extreme buying on December 8 (Z-score +2.5) versus institutional measured caution (Z-scores 0 to +0.5). Clear, simple, actionable.
But when you need deeper insight into intraday dynamics—like understanding exactly when in the trading day institutional selling accelerated—the minute-level data is there.
2. Segmentation
Multiple high-frequency inference methods separate institutional from retail, market makers from informed traders. You know exactly who's moving into and out of a stock—and why it matters.
In Oracle's case, this segmentation revealed the critical insight: retail was betting on hope while institutions remained skeptical about the debt load, software weakness, and OpenAI customer concentration risk.
3. Breadth
All US listed equities across all trading venues. No blind spots in coverage. Whether you're tracking mega-cap AI plays like Oracle or smaller names, the data is comprehensive.
4. Real-Time Intelligence
See accumulation and distribution patterns as they develop—not after the price has already moved. Oracle's lack of institutional enthusiasm throughout the week leading to December 10 was visible in real-time, giving traders the signal to stay defensive. When retail exploded with a +2.5 Z-score on earnings day while institutions remained at normal levels, the warning was unmistakable: this is a gamble, not an investment.
The Bigger Picture: AI Valuations and Information Edge
The Oracle situation perfectly encapsulates the current AI infrastructure dynamic:
Fundamentals: Massive $523B backlog, 68% cloud infrastructure growth, Meta/Nvidia commitments
Valuation concerns: $111.6B debt, negative $10B free cash flow, $50B FY26 capex
Customer concentration: Heavy dependence on OpenAI's Stargate project
Software weakness: Legacy business down 3%, license revenue down 21% YoY
Market structure: Retail hope versus institutional caution
In this environment, timing matters more than thesis. Being right about Oracle's long-term AI prospects doesn't help if you bought at the top of the retail FOMO wave at $223, two days before an 11% drop.
Real-time flow intelligence tells you:
When institutions are staying cautious (modest 0.5B flows with normal Z-scores throughout the week despite upcoming catalyst)
When retail is gambling (extreme +2.5 Z-scores on earnings day signaling desperation positioning)
When divergence creates risk (retail extreme buying on earnings day without institutional participation)
When to stay defensive (lack of institutional conviction despite bullish narrative)
Oracle's situation shows that in today's AI-driven market, narrative alone isn't enough. The story was bullish: record backlog, Meta/Nvidia commitments, Stargate expansion. But the flow data showed that institutions weren't buying the story throughout the week leading to earnings. They understood the risks: debt burden, software weakness, customer concentration, and valuation stretched too far ahead of fundamentals. When retail exploded on earnings day with a +2.5 Z-score while institutions remained at 0 to +0.5, the message was clear: avoid this binary gamble.
The Way Forward
Option 1: The Old Way
Keep trading on headlines and analyst reports. React to earnings announcements when retail has already piled in. Accept that your timing will match consensus—which means buying tops and selling bottoms. Miss the warning signs when retail Z-scores spike to +2.5 on earnings day while institutions remain at 0 to +0.5. Gamble on earnings hoping for miracles, then watch an 11% after-hours drop erase your position.
Option 2: The New Way
Get visibility into what's actually happening in real-time. See institutional caution before and during the catalyst. Identify retail exhaustion and gambling behavior. Position defensively when institutions refuse to participate—not when retail is buying into binary events.
In Oracle's case, the flow data showed exactly what was coming:
Retail buying starting December 4, remaining modest through December 9
Retail extreme buying on December 10 earnings day (Z-score +2.5)
Institutional measured caution throughout (Z-scores 0 to +0.5)
Classic setup: retail gambling on earnings day, institutions refusing to play
You could have:
Stayed defensive when institutional flows remained subdued throughout the week despite upcoming catalyst
Avoided the gamble when retail Z-scores hit +2.5 on earnings day without institutional confirmation
Positioned for downside when divergence signaled institutions had no conviction in the upside case
The information was there. The question is: were you looking?
Stop Reacting. Start Anticipating.
The debate over Oracle's AI future will continue. Bulls will point to the $523 billion backlog and Stargate expansion. Bears will highlight the $111.6 billion debt load and OpenAI concentration risk. The stock will remain volatile as investors wrestle with whether Oracle is a visionary AI infrastructure play or an overleveraged bet on a single customer.
But with real-time flow intelligence, you don't have to guess who's right. You can see exactly what informed money is doing—and position accordingly.
Want to see how this works for your portfolio?
LSEG Equity Flow data, Powered by Exponential Technology, integrates institutional-grade flow analytics with AI-powered pattern recognition. We'll show you exactly what you're missing.
📧 Questions? Email: sales@exponential-tech.ai
📅 Book a Demo: See institutional flows in real-time
🔗 Learn More: exponential-tech.ai
Your competition isn't waiting. Why are you?
About LSEG Equity Flow Data
LSEG Equity Flow data, Powered by Exponential Technology, is based on the US Consolidated Feed and applies deep high-frequency trading knowledge to identify the direction of active risk-taking by institutional buy-side, market makers, and retail traders. With unprecedented 1-minute granularity and 17 years of history, the dataset provides a unique ability to distinguish institutional and retail flow, providing near-real-time market intelligence across the entire US equity market.
